Paradigm Shifts

=================
Five Examples of Paradigm Shifts within Data Analytics and Data Visualization Systems
Paradigm shifts in data analytics and data visualization systems refer to fundamental changes in the approaches and underlying assumptions of how we deal with data.
Here are five notable paradigm shifts:
From Batch Processing to Real-time Streaming
From Rigid Schemas to Schema-less Datastores
From Traditional BI to Self-service BI
From Static Visualizations to Interactive Dashboards
From Centralized Data Warehouses to Distributed Data Lakes
Shown below, each of these shifts has significantly impacted how businesses approach data, offering increased flexibility, speed, and depth of insight.
==========
From Batch Processing to Real-time Streaming:
Old Paradigm: Data was traditionally processed in batches, where accumulated data would be processed at scheduled intervals.
New Paradigm: With the advent of tools like Apache Kafka and Spark Streaming, there's a shift towards real-time data streaming and processing, enabling businesses to make immediate decisions based on live data.

==========
From Rigid Schemas to Schema-less Datastores:
Old Paradigm: Traditional databases (like relational databases) required a fixed schema wherein the structure of the data had to be defined in advance.
New Paradigm: NoSQL databases (like MongoDB, Cassandra, etc.) introduced the idea of schema-less data storage, allowing for more flexibility and adaptability to changing data needs.

==========
From Traditional BI to Self-service BI:
Old Paradigm: Business Intelligence tools were previously complex and required IT specialists to create reports or dashboards.
New Paradigm: Modern BI tools like Tableau, Power BI, and QlikView have empowered end-users. Now, even non-technical users can generate their own reports, visualizations, and insights without depending heavily on IT.

==========
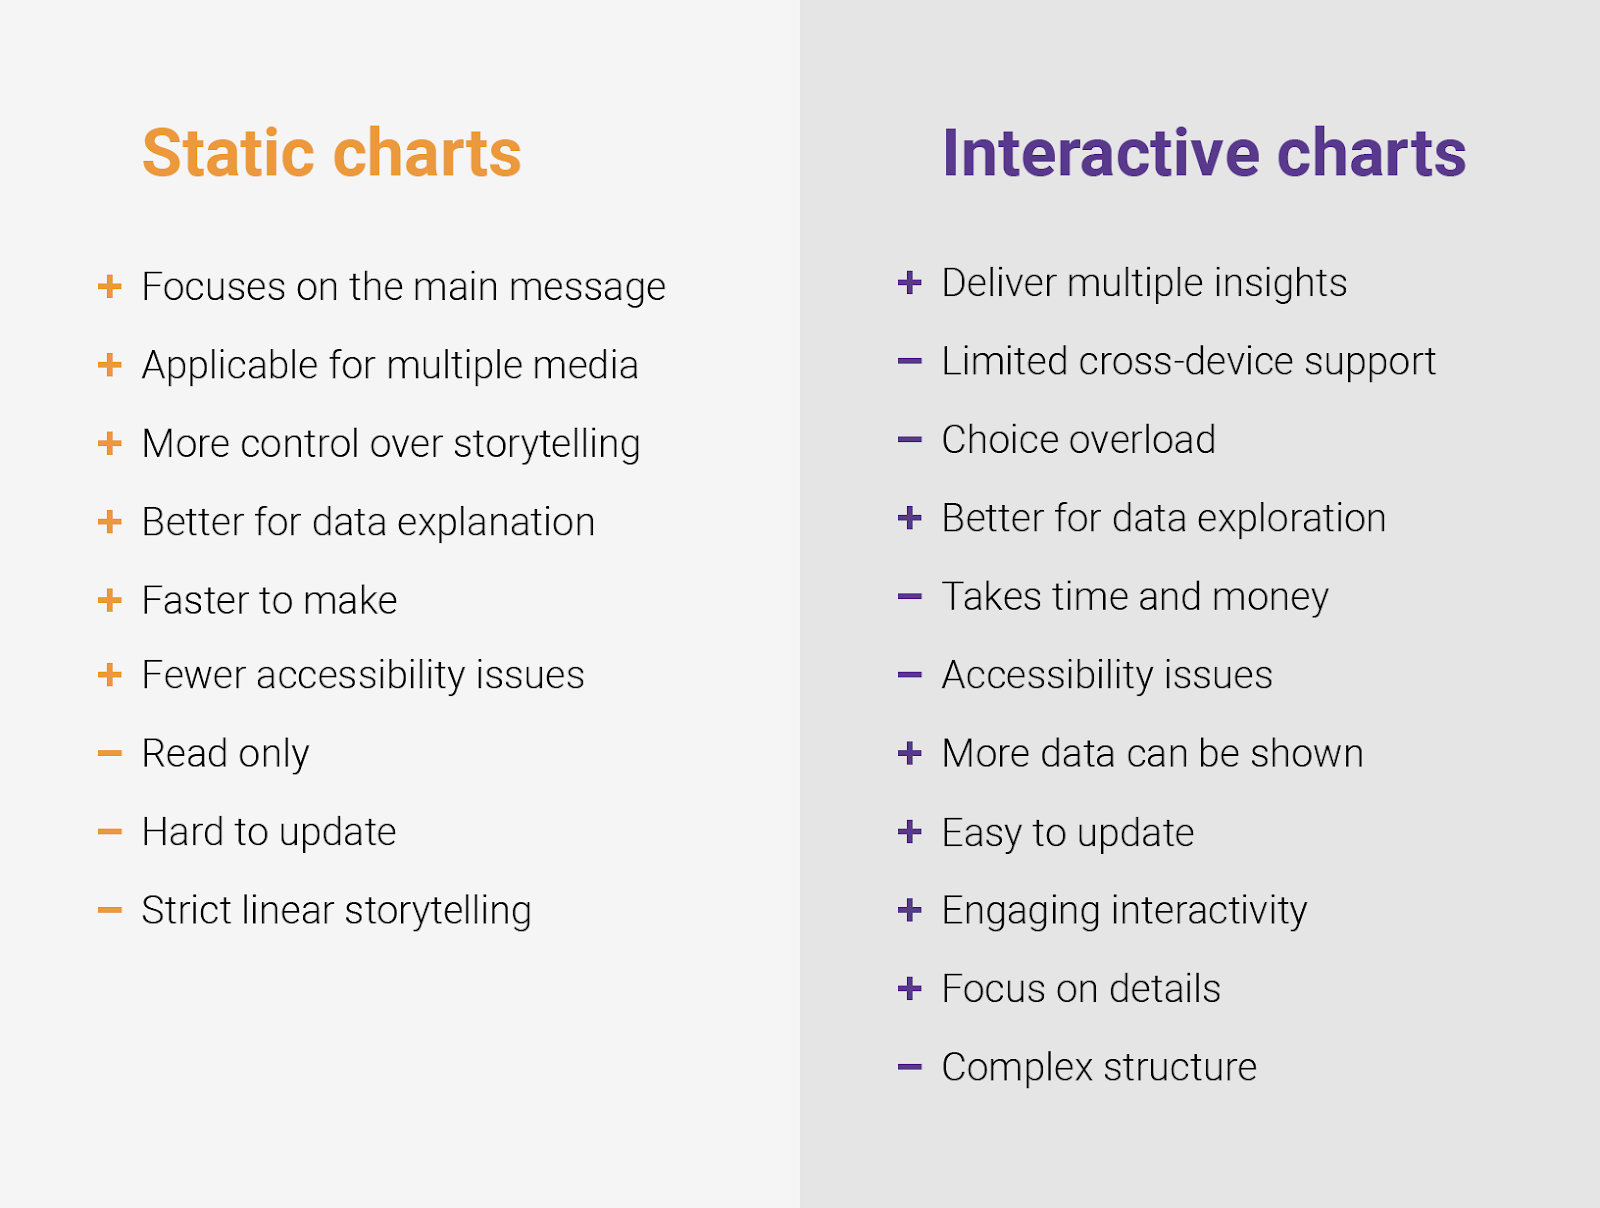
From Static Visualizations to Interactive Dashboards:
Old Paradigm: Data visualizations were traditionally static images or graphs presented in reports.
New Paradigm: With advancements in technology and tools, there's a shift towards interactive dashboards where users can drill down, filter, and explore the Data in real-time, leading to more engaged data discovery and better insights.
==========
From Centralized Data Warehouses to Distributed Data Lakes:
Old Paradigm: Data was predominantly stored in centralized data warehouses where it was cleaned, transformed, and then loaded (ETL process).
New Paradigm: The introduction of data lakes changed the narrative. Data lakes allow for storing vast amounts of raw data in its native format, which can be structured or unstructured. This decentralized approach, combined with the "ELT" process (where data is first loaded and then transformed), provides more flexibility and scalability in handling diverse and big data.

No comments:
Post a Comment