Pinterest

Showing posts with label #bigdata. Show all posts

Wednesday, October 18, 2023

Predictive Analytics, Digital Marketing, and Data Visualization

Predictive Analytics, Digital Marketing, and Data Visualization are all intertwined elements in the modern business and marketing landscapes. Let's break down how each of them is related to the others:

  1. Predictive Analytics:

    • Definition: This involves using statistical algorithms and machine learning techniques to identify the likelihood of future outcomes based on historical data. The goal is to go beyond knowing what has happened to providing a best assessment of what will happen in the future.
    • Connection to Digital Marketing: Predictive analytics can be used in digital marketing to forecast consumer behavior, sales trends, and marketing campaign effectiveness. For example, by analyzing a customer's past purchasing behavior, a company can predict which products the customer might be interested in the future and thus can tailor their advertising efforts accordingly.
    • Connection to Data Visualization: The results of predictive analytics models can be complex. Data visualization tools help in presenting these results in a more understandable and actionable manner. Graphs, heat maps, and other visual formats can help stakeholders grasp the findings quickly and make informed decisions.

  2. Digital Marketing:

    • Definition: This refers to advertising delivered through digital channels such as search engines, websites, social media, email, and mobile apps.
    • Connection to Predictive Analytics: Digital marketing campaigns produce a lot of data. This data can be fed into predictive models to optimize campaigns, allocate budgets more efficiently, and target the right audience segments.
    • Connection to Data Visualization: Digital marketing efforts result in vast amounts of data. Data visualization is crucial to interpret this data at a glance. For instance, a dashboard might show website traffic, conversion rates, and ad spend, enabling marketers to quickly assess the performance of their campaigns and adjust strategies accordingly.

  3. Data Visualization:

    • Definition: This involves the representation of data in a graphical or pictorial format, allowing users to see complex concepts in a more understandable and visual way.
    • Connection to Predictive Analytics: Visualization is essential for interpreting the results of predictive analytics. It aids in understanding patterns, correlations, and trends in data, which can be intricate when presented as raw numbers.
    • Connection to Digital Marketing: As mentioned, digital marketing results in copious amounts of data. Data visualization helps marketers make sense of this data, from tracking website visitors' journey to understanding social media engagement metrics.

In essence, the synergy among these three elements can be described as follows:

  • Predictive Analytics provides insights and foresights based on historical data.
  • Digital Marketing acts on these insights to target and engage consumers.
  • Data Visualization makes both the insights from predictive analytics and the results from digital marketing campaigns understandable and actionable.

In a world driven by data, the combination of these three elements can significantly amplify the efficiency and effectiveness of business strategies, especially in the realm of marketing.

Tuesday, October 03, 2023

Paradigm Shifts and Data

 Paradigm Shifts 


=================


Five Examples of Paradigm Shifts within Data Analytics and Data Visualization Systems


Paradigm shifts in data analytics and data visualization systems refer to fundamental changes in the approaches and underlying assumptions of how we deal with data


Here are five notable paradigm shifts:


  • From Batch Processing to Real-time Streaming

  • From Rigid Schemas to Schema-less Datastores

  • From Traditional BI to Self-service BI

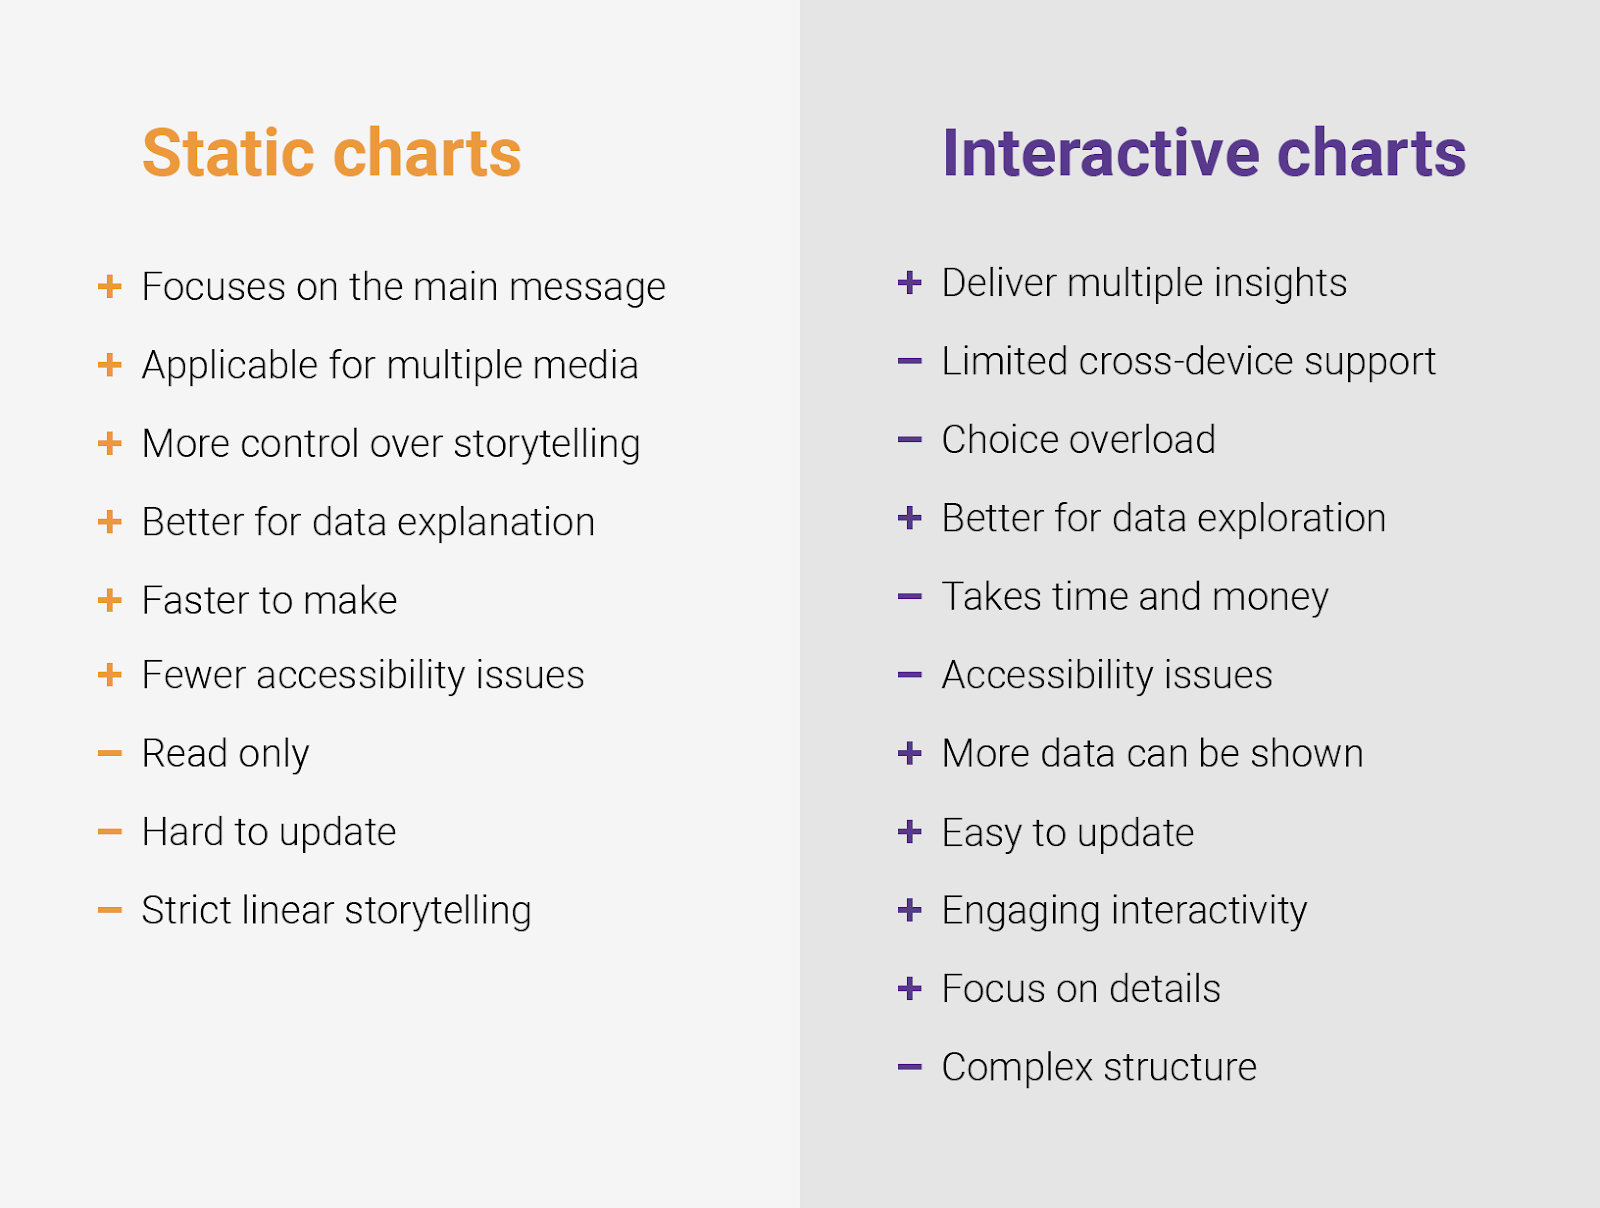
  • From Static Visualizations to Interactive Dashboards

  • From Centralized Data Warehouses to Distributed Data Lakes


Shown below, each of these shifts has significantly impacted how businesses approach data, offering increased flexibility, speed, and depth of insight.


==========


  • From Batch Processing to Real-time Streaming:


Old Paradigm: Data was traditionally processed in batches, where accumulated data would be processed at scheduled intervals.


New Paradigm: With the advent of tools like Apache Kafka and Spark Streaming, there's a shift towards real-time data streaming and processing, enabling businesses to make immediate decisions based on live data.


==========


  • From Rigid Schemas to Schema-less Datastores:


Old Paradigm: Traditional databases (like relational databases) required a fixed schema wherein the structure of the data had to be defined in advance.


New Paradigm: NoSQL databases (like MongoDB, Cassandra, etc.) introduced the idea of schema-less data storage, allowing for more flexibility and adaptability to changing data needs.


==========


  • From Traditional BI to Self-service BI:


Old Paradigm: Business Intelligence tools were previously complex and required IT specialists to create reports or dashboards.


New Paradigm: Modern BI tools like Tableau, Power BI, and QlikView have empowered end-users. Now, even non-technical users can generate their own reports, visualizations, and insights without depending heavily on IT.

  • ==========


  • From Static Visualizations to Interactive Dashboards:


Old Paradigm: Data visualizations were traditionally static images or graphs presented in reports.


New Paradigm: With advancements in technology and tools, there's a shift towards interactive dashboards where users can drill down, filter, and explore the Data in real-time, leading to more engaged data discovery and better insights.


==========


  • From Centralized Data Warehouses to Distributed Data Lakes:


Old Paradigm: Data was predominantly stored in centralized data warehouses where it was cleaned, transformed, and then loaded (ETL process).


New Paradigm: The introduction of data lakes changed the narrative. Data lakes allow for storing vast amounts of raw data in its native format, which can be structured or unstructured. This decentralized approach, combined with the "ELT" process (where data is first loaded and then transformed), provides more flexibility and scalability in handling diverse and big data.


Monday, October 02, 2023

The Future is in Data Analytics and Humor

The future is increasingly becoming shaped by data analytics and technology, but the role of humor is an interesting lens through which to consider it. Here's how these two seemingly disparate elements could intertwine:

Data Analytics


  • Decision Making: From business and healthcare to politics and education, data analytics is aiding in smarter, faster decision-making.


  • Personalization: Tailoring products, services, and experiences for individuals has been enhanced dramatically with analytics.


  • Predictive Analytics: Whether it's predicting the next big trend or forecasting resource needs, analytics can provide invaluable foresight.

Humor


  • Human Connection: In a world increasingly mediated by screens and algorithms, humor remains a uniquely human way to connect.


  • Cultural Currency: Humor, memes, and viral moments often dictate the ebb and flow of the cultural zeitgeist.


  • Mental Health: Humor is a coping mechanism and a way to make life's complexities more manageable.

The Intersection


  • Data-Driven Comedy: Algorithms are starting to understand humor, assisting in the creation of content that could be both funny and relevant to specific audiences.


  • Enhanced Storytelling: Data can enrich storytelling, a key component of humor, by offering insights into what people find engaging or funny.


  • Personalized Humor: Imagine a Netflix comedy special that tailors its jokes in real-time based on your past viewing habits or even your current mood, gauged through biometric data.


  • Humanizing Data: Making data relatable through humor can make complex issues more understandable and approachable.


  • AI and Comedy: As AI learns the nuances of humor, we could see bots become not just functional but entertaining, providing comic relief in everyday interactions.


  • Gamification: Data analytics could make games (which often employ humor) more engaging, using real-time data to adjust the difficulty, pacing, and even jokes.


  • Social Commentary: Both data analytics and humor are powerful tools for social commentary. Data shows us the what, while humor can provide the why.


  • Ethical Considerations: As data analytics grows more sophisticated, conversations around ethics and fairness also become more complex. Humor can be a way to interrogate these complexities, making them accessible and understandable to the general populace.


  • Meme Stocks and Economy: We've already seen how memes and social sentiment can move markets. Data analytics can track and even predict these movements.


  • Crisis Management: During crises, accurate data and levity are both invaluable. Data helps us understand the scope and scale, while humor can lighten the mood and make difficult situations slightly more bearable.


The synthesis of data analytics and humor is a fascinating frontier, combining the depth of human emotion and creativity with the precision and capabilities of modern technology.


Sunday, September 10, 2023

Data Visualization vs. Data Visualisation

The difference in spelling— "visualization" in American English and "visualisation" in British English—generally has no impact on the meaning of the word or the field it represents. Both spellings refer to the representation of data or concepts in visual form, like charts, graphs, or other graphical elements, to make complex information easier to understand.

However, the difference in spelling can serve as a cultural or regional marker:


  • Consistency: If you're writing in American English, you would use "visualization" to maintain consistency in spelling throughout your work. The same logic applies if you're writing in British English, where "visualisation" would be the norm.


  • Audience: Knowing your audience can help determine which form to use. If your work is targeted towards an American audience or published in American journals, "visualization" would be appropriate. Conversely, if you're targeting a British or Commonwealth audience, "visualisation" might be more suitable.


  • Software and Programming: The American spelling might be the default in some software or programming libraries. For example, you might find that American software companies use the American spelling in their documentation and API descriptions. Being aware of this can avoid unnecessary confusion.


  • SEO and Searchability: If you're producing online content, you might want to consider that people from different regions might use different spellings for the term when conducting web searches. Depending on your audience, you might decide to use one or both spellings to maximize searchability.


  • Professional Context: Certain industries or fields may prefer one spelling over the other due to historical or regional influences. For example, if you're submitting to an academic journal, you should adhere to its language guidelines.


In summary, while the difference in spelling is not significant in terms of meaning, it can have implications for consistency, audience, and regional or industry norms.


Thursday, August 03, 2023

Unleashing the Power of AI and Data Analytics


Transforming Our World

In today's rapidly evolving digital landscape, the fusion of Artificial Intelligence (AI) and data analytics has emerged as an unparalleled force driving innovation and transforming industries across the globe. From businesses to healthcare, education to entertainment, the potential of AI and data analytics to revolutionize our world is unmatched, making them indispensable in the 21st century.

The first and foremost significance of AI and data analytics lies in their ability to extract valuable insights from vast and complex datasets. With the exponential growth of data, organizations have an abundance of information at their disposal. However, without proper analysis, this data remains dormant, offering little value. AI-powered data analytics enables businesses to comprehend patterns, trends, and correlations within this data, empowering them to make informed decisions, optimize operations, and gain a competitive advantage.

Furthermore, AI and data analytics pave the way for personalized experiences. In fields like marketing, AI algorithms can analyze customer behavior and preferences, tailoring products and services to individual needs. This not only enhances customer satisfaction but also fosters stronger customer loyalty and brand engagement.

Moreover, AI-driven data analytics is revolutionizing healthcare. It helps identify disease patterns, improve diagnosis accuracy, and discover potential treatments, leading to more effective healthcare solutions and ultimately saving lives.

Another crucial aspect is the role of AI and data analytics in bolstering efficiency and productivity. In manufacturing and supply chain management, AI optimizes processes, predicting demand, and streamlining production, thus reducing costs and minimizing waste. Similarly, in agriculture, AI helps monitor crop health, predict weather patterns, and optimize irrigation, revolutionizing the way we produce food.

However, while embracing the potential of AI and data analytics, we must also be mindful of ethical considerations. Data privacy, security, and bias are critical issues that require constant vigilance and responsible practices to safeguard against potential risks.

In conclusion, the symbiotic relationship between AI and data analytics holds enormous potential for reshaping our world. From unlocking new insights to delivering personalized experiences and driving efficiency, the applications are endless. Embracing these transformative technologies responsibly will undoubtedly lead us into a future of boundless possibilities, ultimately making the world a smarter, more innovative, and inclusive place for all.

Wednesday, April 27, 2022

grjenkin.com/articles

As an independent researcher and blogger, I’m especially focused on data visualization and digital marketing. The future is in data analytics and humor.

Read my top articles The Data Daily